Open ocean & forest intelligence

What is happening here, and can I cite it?

Tidewatch puts coral heat stress, sea-surface temperature, sea level, protected areas, maritime zones and 25 years of tree-cover loss on one map. Click any place to get a cited, licence-aware brief built from NOAA, NASA, UNEP-WCMC, UMD and VLIZ data.

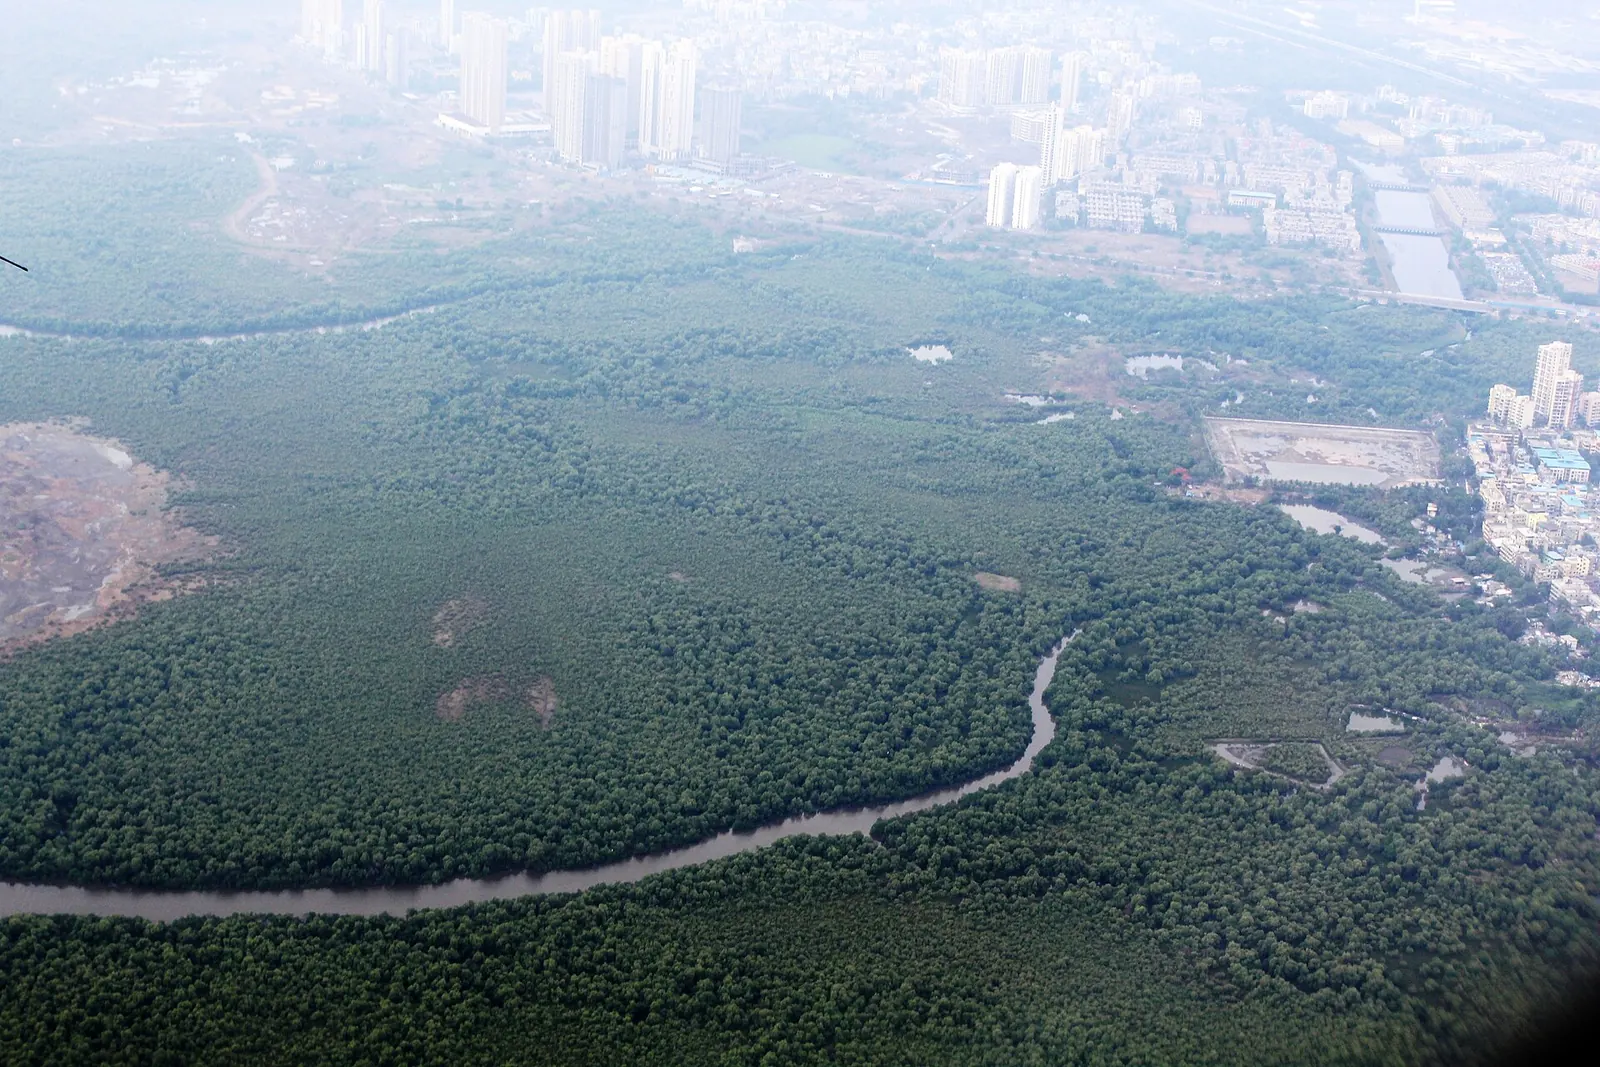
Globe with 214 NOAA coral heat-stress stations, mangrove extent and places in the news

Reef stress: NOAA Coral Reef Watch, Oct. 20, 2026 · Mangroves: GMW v3 (2020) · Forest loss: GFW/UMD 2020–2024 · News: last 30 days · Imagery: NASA Blue Marble

The problem

The data exists. It’s scattered across many portals, each with its own licence.

Practitioners describe the same friction again and again: dozens of portals, inconsistent formats, unclear reuse terms, and maps that report protection coverage as if it were quality. Small teams without GIS staff lose days just assembling the basics for a site.

Tidewatch does not replace the datasets. It works as a navigator: it brings the authoritative layers into one view, shows the exact numbers at any point, and tells you where each number came from and what you may do with it.

Read the problem research
“There are too many tools… We don’t need another tool.”
Coastal resource manager, interviewed for USGS SIR 2023-5081
“Oftentimes, you’re dealing with piecemeal data…”
Practitioner, USGS SIR 2023-5081
“Well, I hate to admit it, but I go to Google…”
Practitioner, on how they find data (USGS SIR 2023-5081)
A quarter of the coverage of the 100 largest MPAs is not yet implemented, and a third allows activities incompatible with conservation.
Grorud-Colvert et al., Conservation Letters (paraphrased)

Who it’s for

For the people who answer “what’s happening here?”

Reef managers

“When did heat stress hit my reef, and how bad was it?”

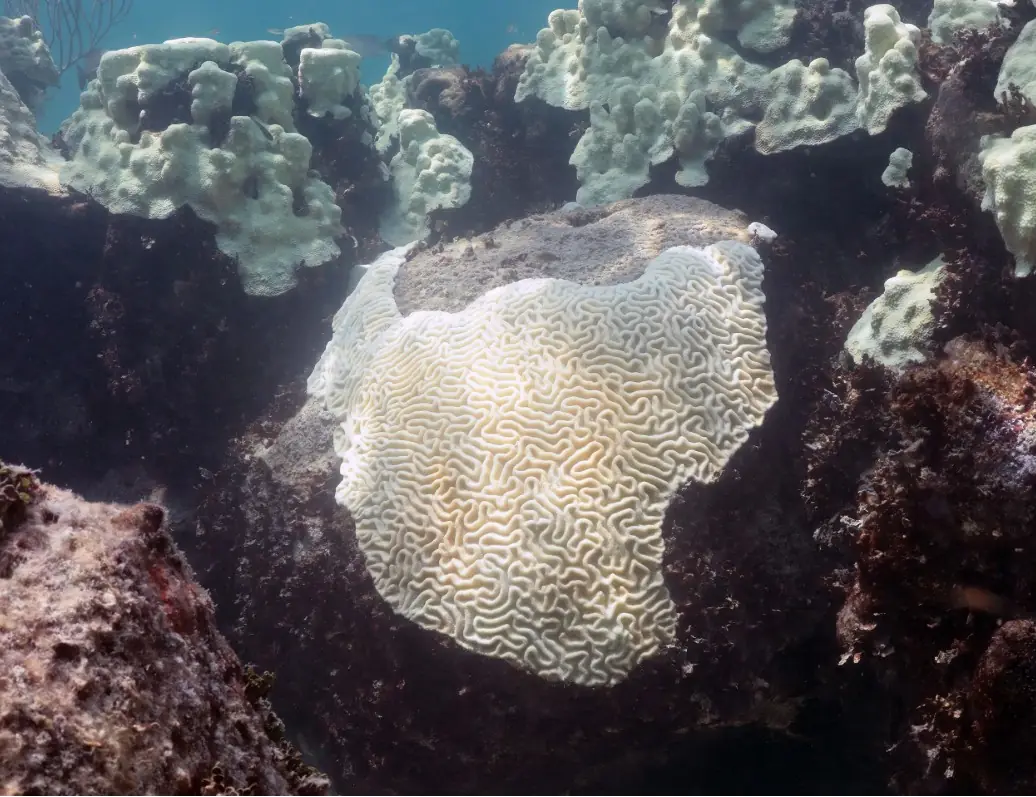
Daily NOAA Coral Reef Watch sea-surface temperature, anomaly and Degree Heating Weeks for the 5 km pixel over your site, against the CRW alert levels. Print it as a site brief for a monitoring report.

Satellite SST matches loggers well at monthly scales but misses daily peaks, so pair it with in-water loggers (Bos & Pinsky, Coral Reefs 2025).
MPA planners

“How much is protected, and how well?”

WDPA sites with their IUCN category, status and no-take field as reported, the EEZ and its sovereign, and national MPA coverage against the 30×30 target, in a brief for a point or a whole EEZ.

Designation isn’t protection: about 8.4% of the ocean is in MPAs, but about 2.8% is fully or highly protected (Protected Planet Report 2024).

Forest NGOs

“What changed on the ground, and can we show funders?”

Year-by-year tree-cover loss since 2001, active fires and mangrove extent on one map. A site brief bundles the map, national trends and full citations, ready for a grant or donor report.

Tree-cover loss is not deforestation, and it can miss small clearings: in one area of small forest plots, only 11.1% of mapped forest-loss patches were detected (Yamada et al., Remote Sensing 2020).

Journalists

“Is this number real, and can I republish it?”

Headlines from established newsrooms and science agencies, linked to the matching map layer. Every value in a brief carries its dataset, version, access date and licence.

Licences differ: the WDPA, for example, can’t be redistributed or used commercially without permission (UNEP-WCMC licence). Tidewatch shows it but never exports it.

What’s changing

Four signals you can explore today

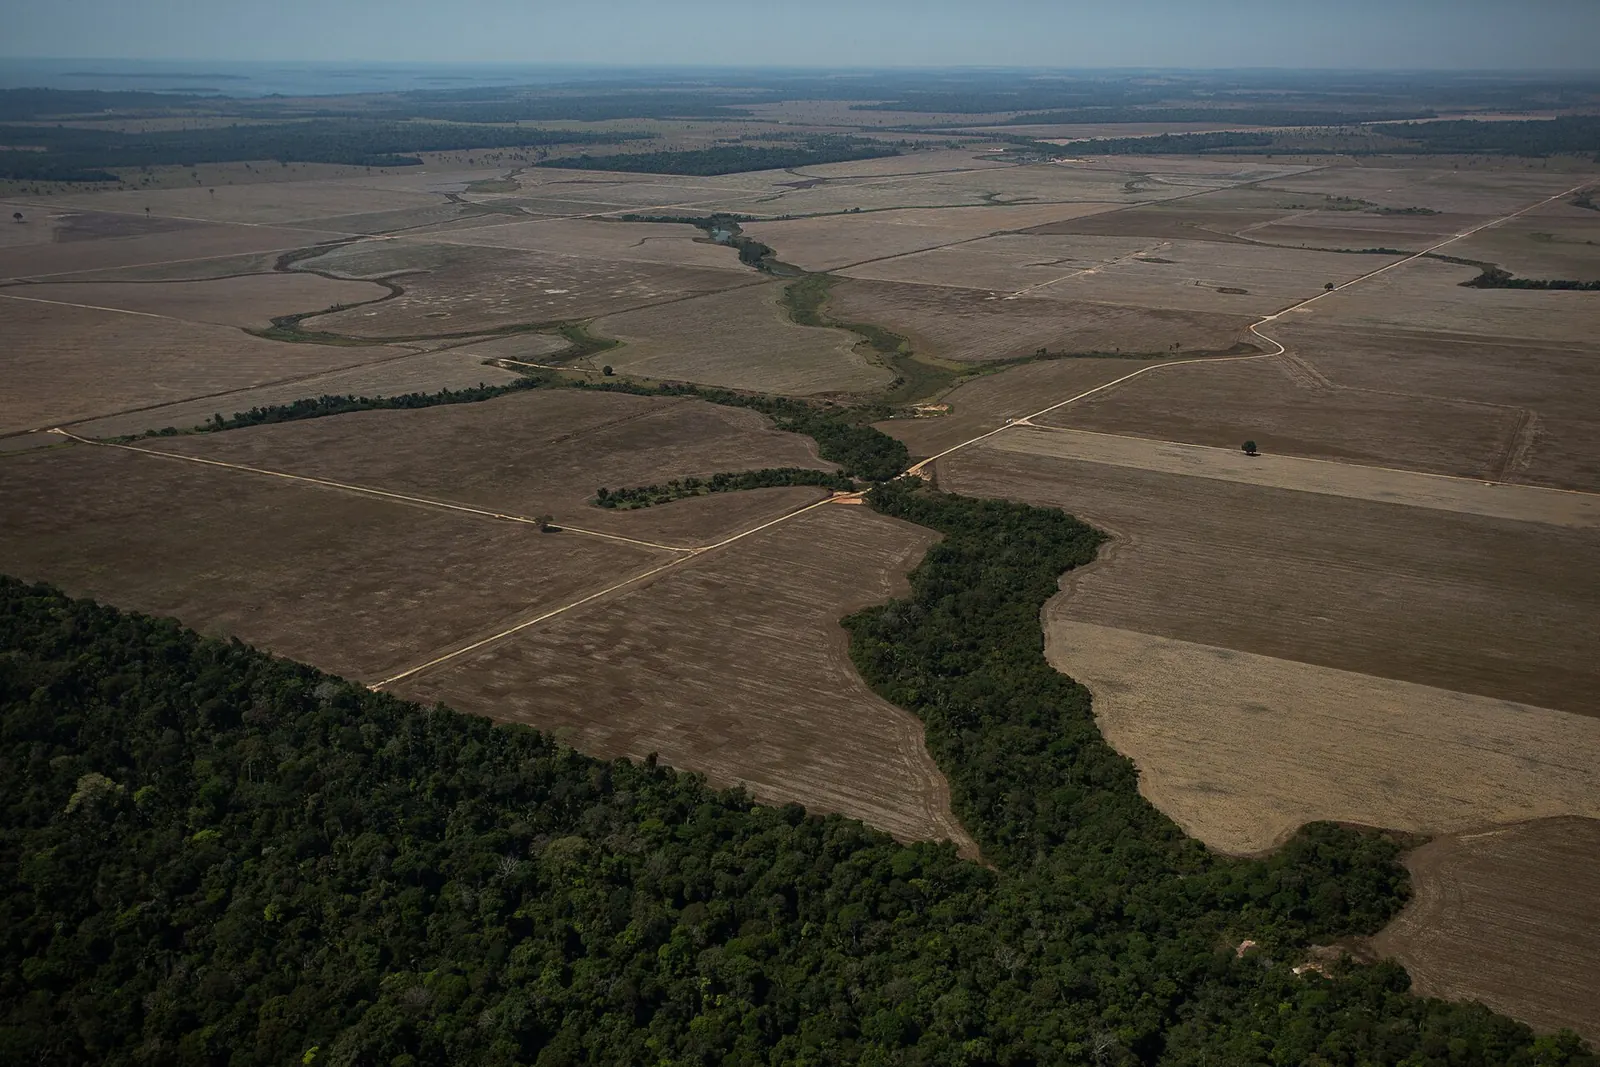
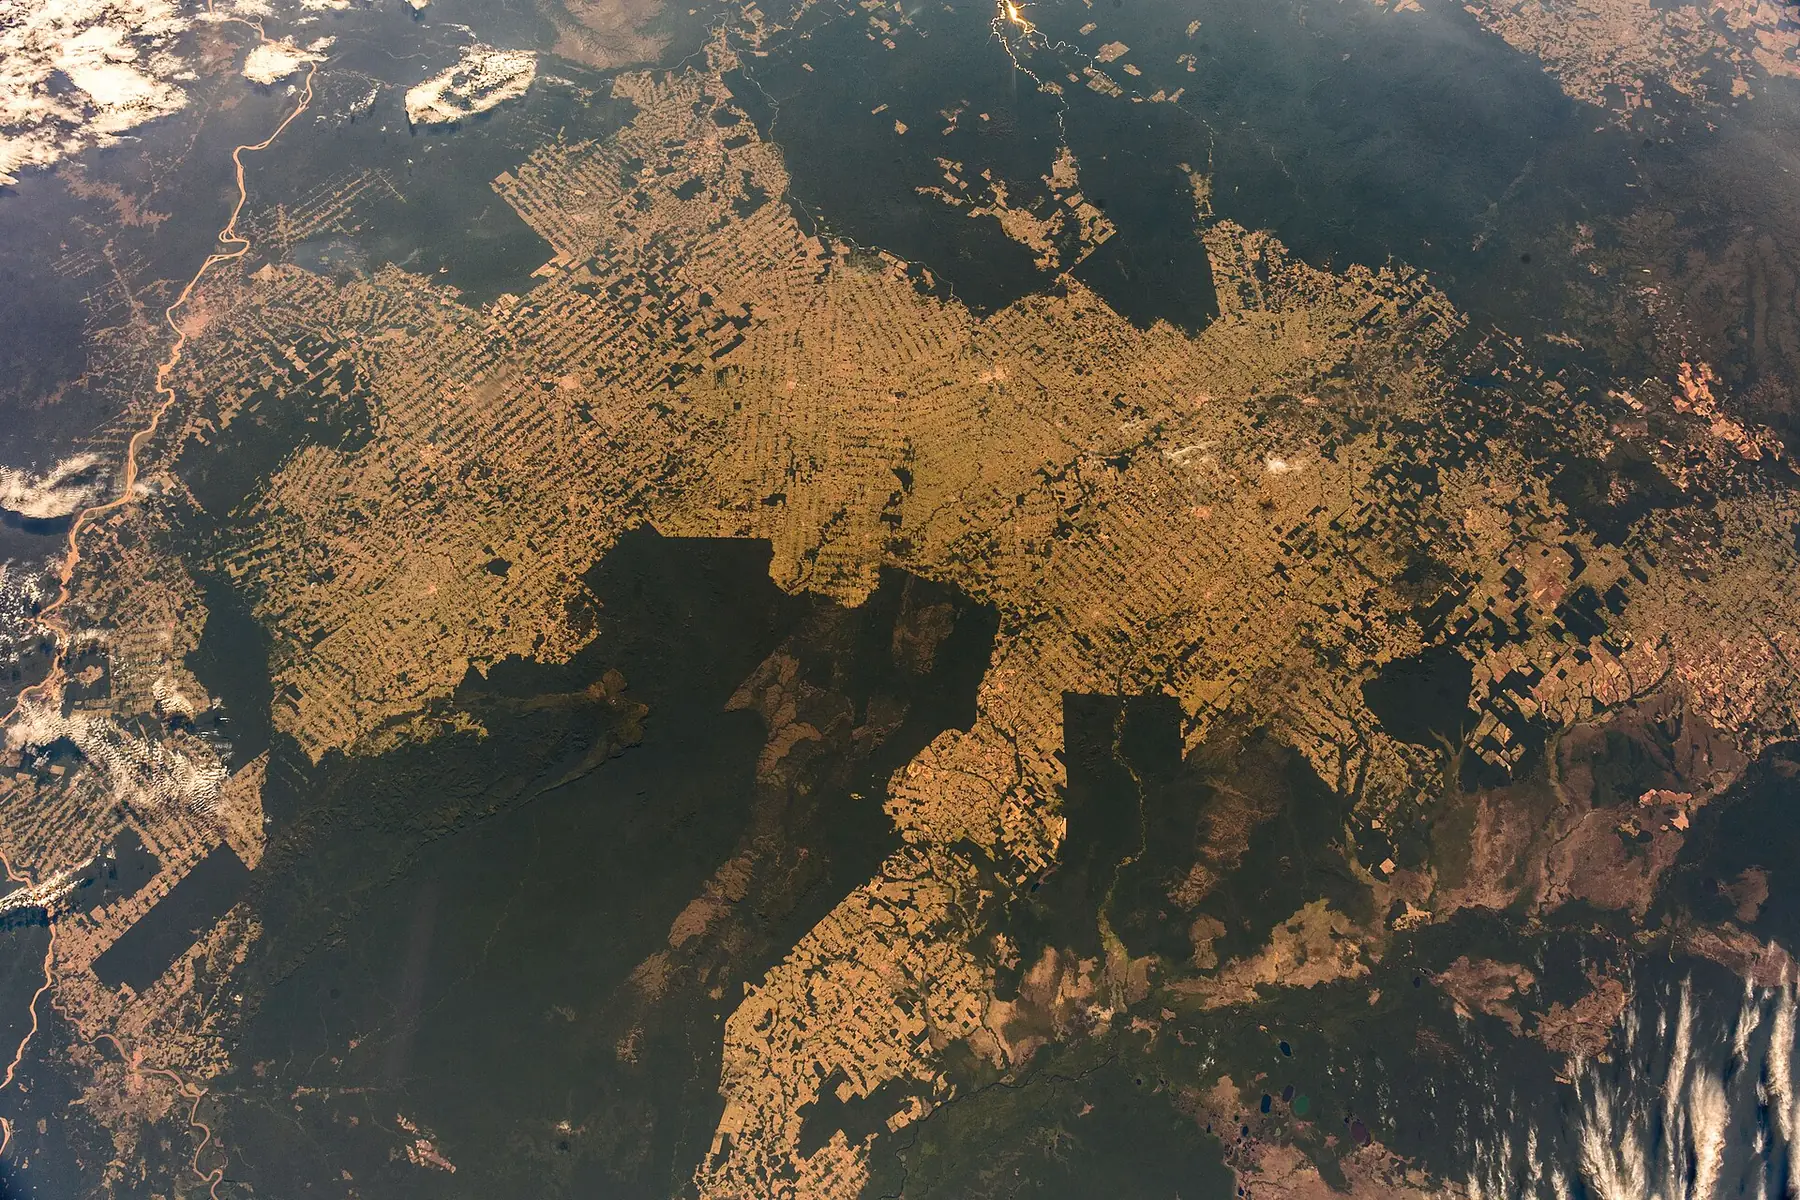
Aerial view of burning forest in Rondônia, Brazil, August 2020 (Bruno Kelly / Amazônia Real)

Fire is the new driver

University of Maryland researchers mapped 36.6 Mha of forest disturbed by fire in 2023 and 38.3 Mha in 2024, the highest since monitoring began in 2001. Fire was 42% of all forest disturbance in those years, up from 26–29% in 2001–2019.

A thermal anomaly marks heat at the time of the overpass. It can be a wildfire, an agricultural burn or a gas flare.

What you get

Built for people who write the report afterwards

Place briefs

Click anywhere to get the EEZ, Large Marine Ecosystem, sea, protected areas, nearest tide gauges and 90-day coral heat stress, gathered in one panel.

Time you can scrub

Daily NOAA and NASA layers on a date slider. Tree-cover loss runs on a year-range slider (2001–2025), decoded in your browser so it updates instantly.

Real time series

Up to 40 years of NOAA CRW SST, anomaly and Degree Heating Weeks at a 5 km pixel, and more than a century of monthly sea level at UHSLC gauges, with trends shown only when the record is long enough.

Licence-aware

Every layer carries plain-language badges: Open, Attribution, View only, Non-commercial. Restricted data such as the WDPA is displayed live and never exported.

Cite in one click

Each brief lists the exact datasets, versions and DOIs behind every number, ready to paste into a report or grant.

Export what you may

Download boundaries, briefs and time series as GeoJSON or CSV, with licence and citation metadata embedded. You can only export what you are allowed to share.

Data sources & credits

22 layers, each with its source and licence

These entries come from the same catalog the map uses (GET /api/layers), so the licence you see here is the one the app enforces. Full notes are in DATA_SOURCES.md in the repository and on the methodology page.

LayerProviderResolution · cadenceLicence
Coral bleaching alert areaNOAA Coral Reef Watch (served via PacIOOS ERDDAP)0.05° (~5 km)
Daily (1985–present)
U.S. Government work (public domain); cite NOAA CRW
Open
Degree Heating WeeksNOAA Coral Reef Watch (via PacIOOS ERDDAP)0.05° (~5 km)
Daily
U.S. Government work (public domain); cite NOAA CRW
Open
Sea surface temperature anomalyNASA JPL PO.DAAC · GHRSST MUR (via NASA GIBS)0.01° (~1 km), rendered to zoom 7
Daily, ~1 day latency
NASA open data (no restrictions; attribution requested)
Open
Sea surface temperatureNASA JPL PO.DAAC · GHRSST MUR (via NASA GIBS)0.01° (~1 km), rendered to zoom 7
Daily
NASA open data (no restrictions; attribution requested)
Open
Chlorophyll-a (PACE OCI)NASA OB.DAAC · PACE OCI (via NASA GIBS)~1 km, rendered to zoom 7
Daily (2024–present); gaps under cloud and sun-glint
NASA open data (no restrictions; attribution requested)
Open
Protected areas (WDPA)UNEP-WCMC & IUCN · Protected PlanetVector polygons (national reporting)
Monthly
WDPCA Terms (non-commercial; no redistribution)
View onlyNon-commercial
MPA coverage vs 30×30, by countryWorld Bank WDI (ER.MRN.PTMR.ZS), from UNEP-WCMC & IUCN Protected Planet (WDPA / WD-OECM)Country
Annual (snapshot in data/processed/stats)
World Bank data CC BY 4.0; derived from WDPA/WD-OECM (non-commercial)
View onlyNon-commercial
Exclusive Economic ZonesFlanders Marine Institute (VLIZ) · MarineRegions.orgGeneralised (low-res) and further simplified for the web
Versioned (v12, 2023)
CC BY 4.0
Attribution
Large Marine EcosystemsNOAA LME Program · distributed by MarineRegions.orgSimplified vector
Static
CC BY 4.0
Attribution
Continental shelf & deep oceanNatural Earth1:10m, simplified
Static
Public domain
Open
GEBCO bathymetry (shaded)GEBCO Compilation Group (IHO–IOC)15 arc-second grid
Annual releases
GEBCO terms (public domain; attribution required)
Attribution
Tide gauges (UHSLC)UHSLC / GLOSS (via UHSLC ERDDAP)326 stations
Daily values, ~1–2 month latency
Free use with citation
Attribution
Apparent fishing effortPlannedGlobal Fishing Watch0.01°
Daily, ~72 h latency
CC BY-NC 4.0 (API terms apply)
AttributionNon-commercial
Tree cover loss (Hansen / UMD)Hansen/UMD/Google/USGS/NASA · tiles by Global Forest Watch30 m (Landsat)
Annual
CC BY 4.0
Attribution
Active fires (VIIRS 375 m)NASA FIRMS / LANCE (via NASA GIBS)375 m
Daily, near real time
NASA open data (no restrictions; attribution requested)
Open
Mangrove extent 2020 (GMW v3)Global Mangrove Watch (Aberystwyth Univ., soloEO, Wetlands International, TNC, JAXA) · hosted by UNEP-WCMC~25 m
Annual extents (v3: 1996–2020)
CC BY 4.0
Attribution
Tree cover loss by country (2001–2024)University of Maryland GLAD · Global Forest Watch (via Our World in Data)Country
Annual (snapshot in data/processed/stats)
CC BY 4.0
Attribution
Mangrove change by country (1996–2020)Global Mangrove Watch v3.0 (Aberystwyth University, soloEO, JAXA, Wetlands International, TNC)Country
GMW epochs 1996, 2007–2010, 2015–2020
CC BY 4.0
Attribution
Mangrove extent 1996 (GMW v3, outline)Global Mangrove Watch · hosted by UNEP-WCMC~25 m
1996 epoch
CC BY 4.0
Attribution
CountriesNatural Earth1:50m, simplified
Versioned
Public domain
Open
Seas & ocean namesNatural Earth1:10m, simplified
Versioned
Public domain
Open
News (geotagged stories)Tidewatch news Worker (feeds listed on /news)Place centroids (country label points, sea and EEZ centroids, cities)
Every 4 hours
Headlines and links only; each story stays under its publisher's terms
View onlyNon-commercial
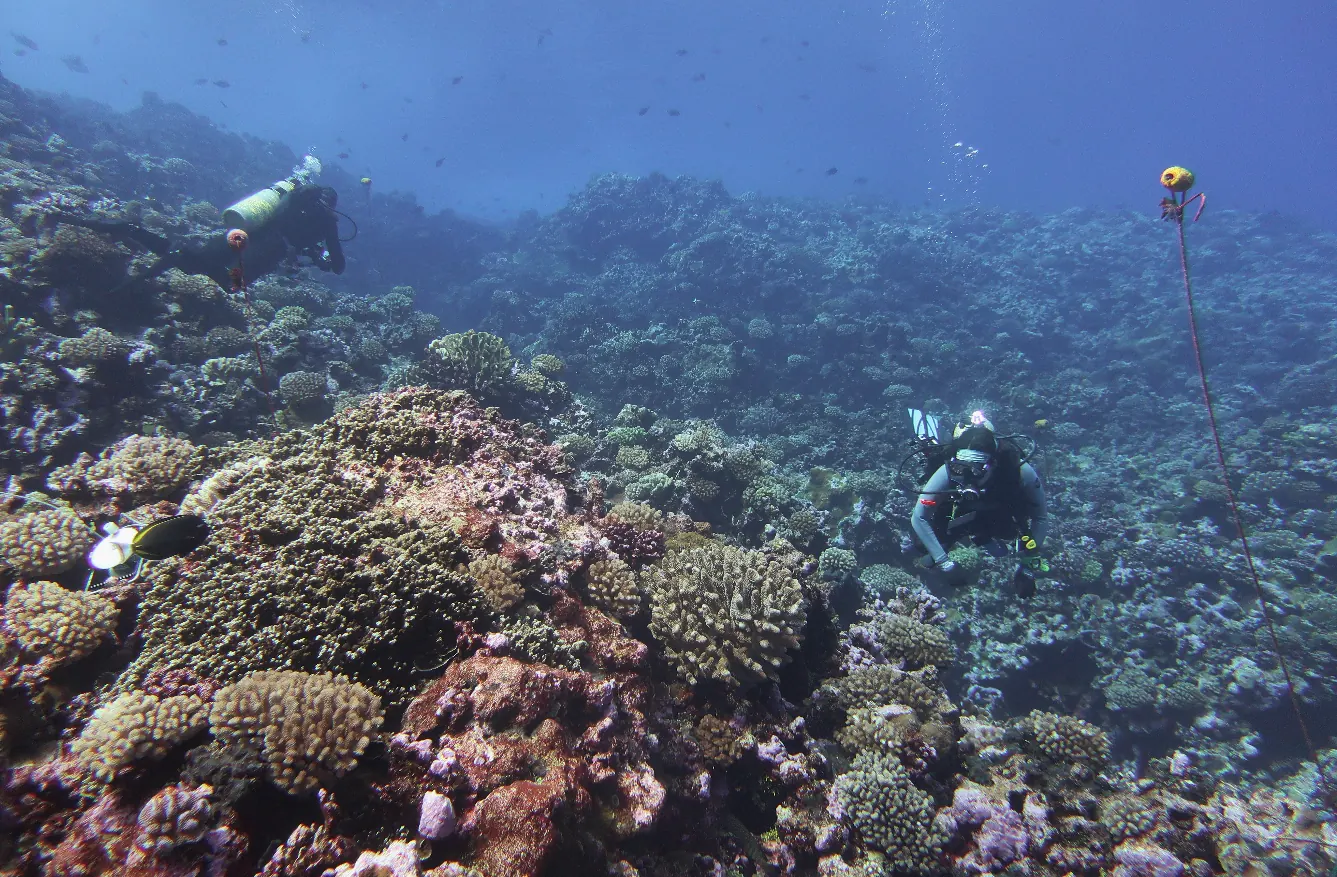
NOAA divers surveying a coral reef at Rose Atoll, American Samoa, 2023Satellites flag risk. Surveys like this one at Rose Atoll confirm what actually happened.

Methodology & how to cite

No number without a source

  • Live from the source. Raster layers are requested directly from NOAA, NASA GIBS, GEBCO, UNEP-WCMC and GFW tile services. Tidewatch does not re-render them.
  • Exact values at a point. Coral heat stress is read from the nearest NOAA CRW 5 km grid cell via ERDDAP. Sea level is monthly means of UHSLC fast-delivery daily data, keeping only months with at least 15 days of data.
  • Honest trends. A sea-level trend (ordinary least squares) is shown only when the record spans at least 10 years. It is the relative sea level at the gauge, including any land motion.
  • Simplified boundaries are labelled. EEZ and LME polygons are simplified for the web and are not for legal or area calculations.
Cite Tidewatch

Tidewatch (2026). Tidewatch: an open map of ocean and forest change, v0.1. Toradle. Accessed 2026-10-22. Cite the underlying datasets listed in each place brief.

Full methodology, caveats and per-layer citations

Start with a place you care about.

Search for a country, EEZ, sea, Large Marine Ecosystem or tide gauge, or just click the map.

Open the map

Photo credits